Chart Editor and Beyond
PRODUCT
SaaS B2B
________
User to: Synthesize Data
________
User by: Market Researcher, Statistician
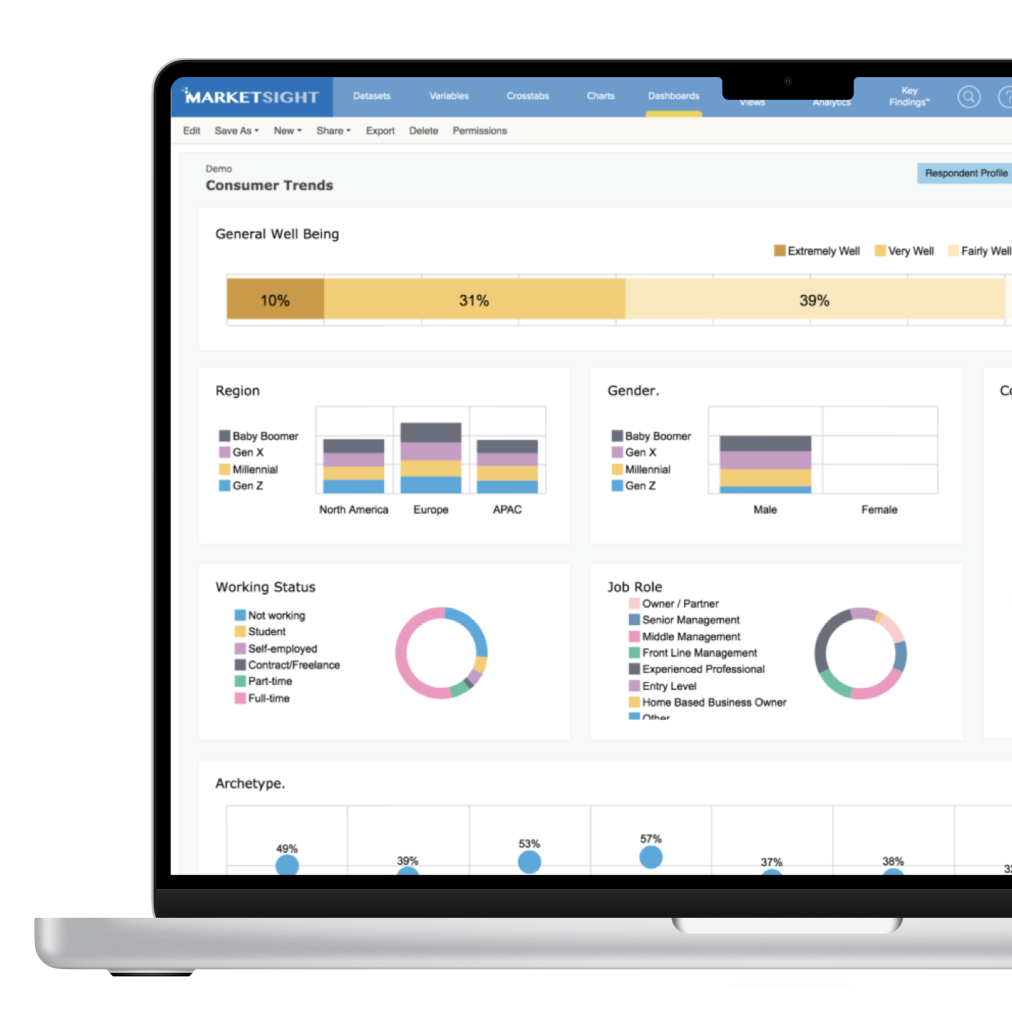
This multifaceted solution to improve the chart and dashboard building areas of the product brought existing users to explore the wonder of visual story-telling. These actions also attracted new users, and added appeal to the our holding company.
After learning the edges of the MarketSight tool through exploring data analytics, building a library of charts and dashboards, and starting a professional services, Myself and partner embarked on a plan to improve charts starting with a baseline test for a span of different user types.
Impact
Crosstab Conversion
3%
more users continued to charts from crosstabs
Charts Usage
3.2%
increase traffic from the charts homepage.
Dashboard Usage
5%
increase in dashboard usage.
Chart Exports
2%
Increase in chart exports

Process
-
![]()
Baseline testing
I invited a collection of different user types into the office. These user types included Data Analyst Sr, Data Analyst Jr, Statistician, Marketing Analyst, and Small business owner.
During this time we probed and observed users interaction with the tools to do various tasks.
-
![]()
-
![]()
Competitive Analysis
Competitive analysis often took place in the form of actually downloading trails and working with various tools.
-
![]()
Professional Services
As a pre-curser to this work, I engaged in hand on learning of the tool to build a professional serviced practice. See the case study for “Service and System” design.
-
![]()
Whiteboard sessions
This was the last project I did before Covid when we still gathered in the office. For this work, we used the whiteboard a ton. To understand a hard concept, to spit ball an idea, or to flesh out and idea, this team was live on the board and it was great!
-
![]()
In addition to the whiteboard, idea sessions also came in the form of conversations or presentations.
-
![]()
Card sort
This work involved a feature rich current experience. The Ui was dense and really just feature staked upon feature for years. To sort this out, I asked users to categorize functions into as many as 8 different groups and explain why. We then showed them a design of pre grouped sections and discussed.


Deliver
Low hanging fruit
Without having to spend much time, we could direct members to chart interactions from other areas in the product.


Sorted
Reorganizing this feature rich chart editing experience came as a result of a card sorting test. The new categories help to harness a gnarly set of complex features and settings.

Contextual Education
Myself and the product lead designed and implemented guided tours and onboarding modules with a tool called what fix. These tours and modules allowed members to learn and experiment with various types of data assets, including charts and dashboards.

Onboarding

Guided help

Templates
Dashboard templates help non-designers create a simple and beautiful story with the data.
Making clear to users that there is a path for a streamlined interactive report. Templates show users they don’t have to labor about design or brand settings and can deliver a beautiful report that reinforces their points. New chart types are also added such as: Area, Scatterplot, Shape plot to grow adoption.